MM

P's Bull-Bear Tasks

Saturday, September 5, 2009

AeroSpace


This chart is showing an interesting character right here. Should it break up through resistance I like the prospects of an inverted head & Shoulders pattern.

Wednesday, August 26, 2009

S&P 500

I think short term the S&P is slightly overbought. We will not open new positions here. When we get a pullback we will be looking for long positions for another leg higher.

APH


I like the basing action in the weekly on APH. Longer term this stock is in an up trend. I see possible upside target around 47.00... Need it to break out, then I'll be looking at the pullback...

Monday, August 24, 2009

Saturday, August 15, 2009

S&P update


Well looking over the weekly chart of the S&P500 I see a few things of interest. First notice the longer term fibo. Currently we also have an inverted head and shoulders. This also goes with the 38.2 fib retrace. So I see a bullish tone down to the support (Red line @ 950). I think the bears task is to drop the p's under 950. Bull task to for support off 950 to hold and bounce off support. So a war is on and now we shall see how pans out. I will say I do think it is possible that we are in a longer term retrace in the P's. My reasoning for that mixes both technical and fundamental info.

Thursday, August 13, 2009

SPY


This weekly chart suggests bullish tones with a possible S/H/S pattern.

What Home Builders?


Home builder stocks have been carving a nice 40 week base and is trying to break. Despite what I think of the homies The group chart is telling me to possibly get bullish with a qtr size in position.

LIFE (QTR BASE)


Here is a quarterly chart of LIFE. Should this one bust up through the base it will have zero overhead supply. I like it long out of the base. Now should it flounder here then we will have to wait and see.

Friday, August 7, 2009


Here are the top ten RSI percent increase for this week. GR is a live position with 1/2 running. I scaled out the other 1/2 @ 1R.
This pic shows date of entry if one just traded each time a signal hit. This means you blindly buy.

7 Reasons Why You Should Invest in Gold Coins Now

1. You can start with a small investment – If you choose to, when you invest in gold coins you can dip your feet in the water before taking a plunge by buying small quantities of gold coins. Build up your collection gradually according to your capacity and interest in this form of investment. For as little as one thousand dollars you can start investing in gold coins right now and start building your future fortune.

2. Gold coins have historically been a good investment -- How well you will do with your investment in gold coins depends on your skill in selecting the right coins and on market forces. However, a study done by Collector’s Universe showed that one thousand dollars invested in U.S rare gold coins in 1970 is now worth $57,977.00. The yield from this particular investment is greater than you would have achieved by investing in gold bullion or in the U.S. stock market.

3. Supply is limited -- This is the main reason why gold coins perform so well as an investment. This limited supply is being chased by a demand for gold coins that is continually growing. Collectors look for coins that are rare in mint condition or those that have never been circulated.

4. Gold coins are easy to sell – Liquidity is an important factor in any investment, and gold coins are easier to sell than gold bars. There are no delays in the sale process whatsoever. You receive your payment immediately.

5. You can divide your sales more easily -- If you have large gold bars, then it is all or nothing when you are thinking of making a sale. However, if you have a good number of gold coins, you can easily take any amount that you want to sell and leave the balance untouched.

6. Gold Coins are safe and easy to store – Gold coins can be stored in a bank safe-deposit box or any other location that is secure and easy to reach.

7. Gold coins can’t devalue according to the whims of some government. Inflation, the cruelest tax of all, will only serve to increase the value of gold coins over time.

Wednesday, August 5, 2009

to·tal·i·tar·i·an
(tō-tāl'ĭ-târ'ē-ən)
adj. Of, relating to, being, or imposing a form of government in which the political authority exercises absolute and centralized control over all aspects of life, the individual is subordinated to the state, and opposing political and cultural expression is suppressed: "A totalitarian regime crushes all autonomous institutions in its drive to seize the human soul" (Arthur M. Schlesinger, Jr.)
n. A practitioner or supporter of such a government.

Tuesday, August 4, 2009

Current Tec list
NVLS looking interesting over 08/03/09 high. Trade bias is wrong should support crack and price fall back into the base.
Well we are Bullish on from a technical view point.

Friday, May 22, 2009


Here is a list of those stocks gaining the most RSI percentage over the last 5 days

Thursday, May 21, 2009

Retail Short

I see retail charts have triggered short today. You can pull up the retail index and see for yourself. This action puts me in the bear camp for retail stocks...

Thursday, May 7, 2009

S&P update


This chart shows why it might not be wise to open new longs. Possible bump into resistance.

Saturday, April 25, 2009

sector action


Here is why so many stocks from the Computer Hardware boys have been bullish. It has that double bottom look about it. I'm bull in dis tech.


Computer Software & Services are trying to get out of a double bottom pattern.


Screen update


Here is my top dogs as per my database

Saturday, April 18, 2009

Market Overview:


Well one cannot argue the broad rally that has been taking grip in the markets. I’m not seeing much setting up and so for now I’m in position management mode. I will become a full bull over the Jan highs @ 945 in the S&P500. If the bulls can clear the 945 area I’ll begin to get a little more aggressive in long positions. One could not rule out a correction in the near future, but things will happen as they may. The S&P is up just over 27% since last low. So a consolidation/correction is in the cards, what do you think?
Going into this week of trading my screens do not have any candidates setting up and so we won’t open any new trades.

Wednesday, April 8, 2009

Market/Stock Review

Running over my screens I see the following groups have been adding in numbers.
Computer Hardware has AAPL and IBM. I like AAPL long
Tech stocks have been showing strength in Computer Software & Services. Here is where I like CSC long off the daily pullback trigger off HOD.. Stop 34.94 @ 1% position size.
Drugs have been showing power this year in fact. I like BIIB, and MYL here for now.
Retail has been strong with BIG FDO HD WMT BBBY and others. Not sure why so many hitting the screen, but maybe people are spending their tax returns.
Telecommunications came out of nowhere with QCOM daily chart showing a first pull back out of a base.

Thus far I like the broad based attempt at this rally.

Saturday, March 28, 2009

Scan Sentiment


Here is a brief market sentiment based off a scan. First we notice we are getting a wide range selection of stocks. Notice retail as several discount stores are doing well despite the bear market. It makes sense for more people to shop at WMT or TJX in a economic slow down. What I find interesting is the home builder that made the list.

Saturday, March 21, 2009

RRC


RRC has been basing for about 22 weeks and is currently testing upper range. I call this phase the moment of truth. The bears and bulls will be rocking for position. Break out traders are on alert waiting to get long and short traders are getting nervous. This environment adds fuel to the fire. Back to the moment of truth, well bears task is simple bring it down and have everyone believe that resistance line will not be broke. The bulls simply need to scare more shorts. Then the longs pile on...

Friday, March 20, 2009

Bear Rally


This is my RSI dog list and these guys have been getting a pretty good beating. Well Notice the percent these dogs have bounced during this rally attempt. These were all added 8 days ago.

Thursday, March 19, 2009

Oil Overview

Here is the brief write up...

http://www.chartwatchers.com/profiles/blogs/2132439:BlogPost:17550

Wednesday, March 18, 2009


Here is current list. Blue indicated day one. Orange ranked highest in database.

Tuesday, March 17, 2009


Current data as percent change since hitting screen

Here is current list of stocks hitting screen. Market remains in buy as per signal, we just follow the signals.

Thursday, March 12, 2009

Screen Results


Here are the percentage increase or decrees from day stock hit screen.

Wednesday, March 11, 2009

Sunday, March 8, 2009


First graph shows time length and next one is gain/loss YTD. Current number 1 spot belongs to MYL for now.

Friday, March 6, 2009


Thursday, March 5, 2009

03/05/2009


I don't have even 10 now


Friday, February 27, 2009


Med stocks have been dropping off and we have a few new ones.

Thursday, February 26, 2009

Update


Wednesday, February 25, 2009

DOW


I think we might need to get back down to this level...


Oil

Currently oil has been running in a range for some time now. I see a bow tie trying to forum off the daily. I would not get too excited about it until it breaks the range highs and has a nice orderly pull back. Anyway oil might be worth keeping an eye on…

XAU

XAU

Market Pulse 03/06/09

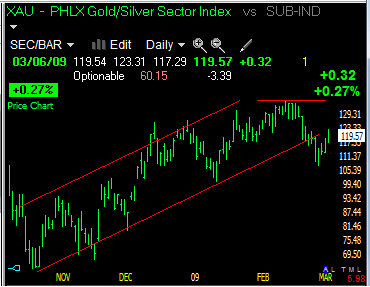
XAU daily suggests a stiff pullback, now what I don’t like about the current bullish action is the drifting in price action. Short term bias is short under March 6 low.


030209

I see a sell signal in the S&P500 as price has violated old lows. Here is a 2 day chart with stocks above or below their 40 pma (Green line). Price is the yellow line and the RS of the 40pma (Red). What I’m looking is the hard right edge. Notice the cross down, this suggests more downward pressure.