MM

P's Bull-Bear Tasks

Saturday, March 28, 2009

Scan Sentiment


Here is a brief market sentiment based off a scan. First we notice we are getting a wide range selection of stocks. Notice retail as several discount stores are doing well despite the bear market. It makes sense for more people to shop at WMT or TJX in a economic slow down. What I find interesting is the home builder that made the list.

Saturday, March 21, 2009

RRC


RRC has been basing for about 22 weeks and is currently testing upper range. I call this phase the moment of truth. The bears and bulls will be rocking for position. Break out traders are on alert waiting to get long and short traders are getting nervous. This environment adds fuel to the fire. Back to the moment of truth, well bears task is simple bring it down and have everyone believe that resistance line will not be broke. The bulls simply need to scare more shorts. Then the longs pile on...

Friday, March 20, 2009

Bear Rally


This is my RSI dog list and these guys have been getting a pretty good beating. Well Notice the percent these dogs have bounced during this rally attempt. These were all added 8 days ago.

Thursday, March 19, 2009

Oil Overview

Here is the brief write up...

http://www.chartwatchers.com/profiles/blogs/2132439:BlogPost:17550

Wednesday, March 18, 2009


Here is current list. Blue indicated day one. Orange ranked highest in database.

Tuesday, March 17, 2009


Current data as percent change since hitting screen

Here is current list of stocks hitting screen. Market remains in buy as per signal, we just follow the signals.

Thursday, March 12, 2009

Screen Results


Here are the percentage increase or decrees from day stock hit screen.

Wednesday, March 11, 2009

Sunday, March 8, 2009


First graph shows time length and next one is gain/loss YTD. Current number 1 spot belongs to MYL for now.

Friday, March 6, 2009


Thursday, March 5, 2009

03/05/2009


I don't have even 10 now


Oil

Currently oil has been running in a range for some time now. I see a bow tie trying to forum off the daily. I would not get too excited about it until it breaks the range highs and has a nice orderly pull back. Anyway oil might be worth keeping an eye on…

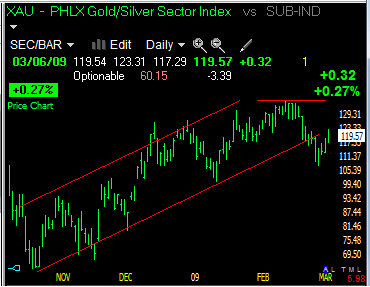
XAU

XAU

Market Pulse 03/06/09

XAU daily suggests a stiff pullback, now what I don’t like about the current bullish action is the drifting in price action. Short term bias is short under March 6 low.


030209

I see a sell signal in the S&P500 as price has violated old lows. Here is a 2 day chart with stocks above or below their 40 pma (Green line). Price is the yellow line and the RS of the 40pma (Red). What I’m looking is the hard right edge. Notice the cross down, this suggests more downward pressure.